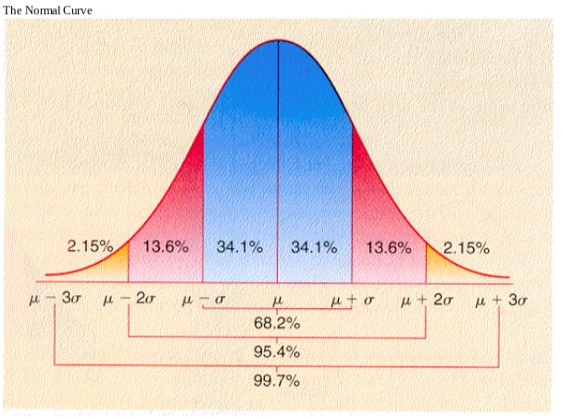
Practice Identifying percentile ranks and scores based on standard deviation
Suppose a test on math anxiety was given to a large group of individuals and the scores are from a normally distributed population in which the mean is 50 and the SD is 10
1) Approximately what % of individuals earned scores below 50?
2) Approximately what % of individuals earned scores above 60
3) Approximately what % of individuals earned scores below 30?
4) Approximately what % of individuals earned scores between 60 and 70?
5) Approximately what % of individuals earned scores between 30 and 70?
6) A score of 60 on this test would give an individual a percentile rank of?
7) The average cost of a new car today is $17,500. If this is normally distributed with a SD of $2000 compute the following. If I am only willing to pay up to $15,500, what percentage of the total number of cars will fall inside my budget?
Answers
1) 50% 2) 16% 3) 2.15% 4) 13.6% 5) 95.4% 6) 84% 7) 16%
