Uncategorized files
Showing below up to 20 results in range #21 to #40.
View (previous 20 | next 20) (20 | 50 | 100 | 250 | 500)
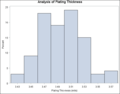 Histogram 1.png 614 × 480; 10 KB
 Int-splts.png 715 × 343; 16 KB
 Interquartile range.gif 546 × 214; 7 KB
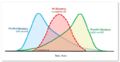
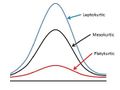 Kurtosis.jpg 617 × 461; 48 KB
 Middle 50.png 380 × 257; 15 KB
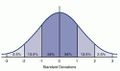
 Normal.jpg 563 × 419; 80 KB
 P(E) definition.JPG 399 × 70; 14 KB
 PSE.png 135 × 135; 22 KB
 Population Standard Deviation Formula.JPG 164 × 100; 10 KB
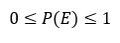 Range of P(E).JPG 121 × 43; 9 KB
 SD.jpg 250 × 148; 5 KB
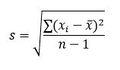 Sample Standard Deviation Formula.JPG 158 × 92; 9 KB
 Samplesize.jpg 468 × 153; 12 KB
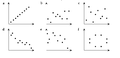
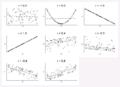 Scatter Plot and r.png 886 × 645; 12 KB
 Skeweness.jpg 638 × 479; 47 KB
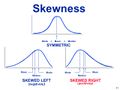
 Skewness.png 446 × 159; 11 KB
 Skewnessexample.png 624 × 321; 118 KB
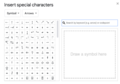 Special Characters Google .png 1,182 × 826; 118 KB
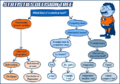 Statdecisiontree.png 468 × 328; 196 KB
 Statistics.JPG 2,448 × 3,264; 378 KB


_definition.JPG)
.JPG)