Difference between revisions of "Standard deviation"
Ciskowskid (talk | contribs) |
Ciskowskid (talk | contribs) (→Standard Deviation Formula) |
||
| Line 44: | Line 44: | ||
The formula for a sample standard deviation is: | The formula for a sample standard deviation is: | ||
| + | |||
| + | [[File:sample-standard-deviation-formula.jpg]] | ||
Revision as of 08:17, 11 February 2022
Why bother finding standard deviation?
Standard deviation can be tedious to calculate by hand, but the value found can provide some very good insight into a set of data, particularly when considered in conjunction with one or more of the measures of central tendency.
Here is a good example. Suppose I had two sets of data. The first, which I will call Set 1, has these characteristics: n = 10 (there are ten pieces of data), mean = medium = mode = 6, the minimum value in Set 1 is 1, and the maximum value in Set 1 is 11 (so the range is 10). The second set of data, whcih I will call Set 2, has exactly the same characteristics (i.e., n = 10, mean = medium = mode = 6, min = 1, max = 11 and range = 10) as Set 1. Would you think that the sets of data had exactly the same numbers in them? They might, but they might not.
Now, consider this additional information regarding the sets: Set 1 has a standard deviation of 3.87, but Set 2 has a standard deviation of 2.24. Could the sets consist of the same data now? Hopefully, it is clear that they cannot. But what do those two values (i.e., 3.87 and 2.24) tell us about the sets, if anything?
Remember that standard deviation is a "measure of dispersion", so the numbers should communicate something about how dispersed the data are in each set. In this case, we would expect the data in the first set to be "more dispersed" than the the data of the second set (since 3.87 is greater than 2.24). In other words, if you were able to look at the data of the two sets side-by-side, the Set 2's data would look more clustered around the number 6 than Set 1's data did.
So let's do that. Here are the sets, in their entirety:
Set 1 = {1, 1, 1, 6, 6, 6, 6, 11, 11, 11} Set 2 = {1, 6, 6, 6, 6, 6, 6, 6, 6, 11}
Though the two sets have some similar qualities, it is easy to see that Set 2 has more of its data bunched near 6 than Set 1 does, or, conversely, that the data associated with Set 1 are more spread out than the data of Set 2. This fact can be determined without having to look at the actual elements of the two sets, however, by finding and understanding the standard deviations of the two sets. Knowing that Set 1 has a standard deviation of 3.87 and that Set 2 has a standard deviation of 2.24 can provide a sense of these dispersions, particularly in a relative sense.
contributed by Chris Ruggiero
Standard deviation measures how much dispersion there is around a mean score. A statistical formula is used to calculate the standard deviation. The larger the standard deviation, the further the score is from the mean; this can be a negative standard deviation and go below the mean or a positive standard deviation and be higher than the mean. The image below shows a normal bell curve, and where the percent of scores would lie in relation to each standard deviation.
File:StandardDeviationBellCurve.jpg
(http://medical-dictionary.thefreedictionary.com/Normal+distribution+curve)
contributed by Cassandra Cosentino
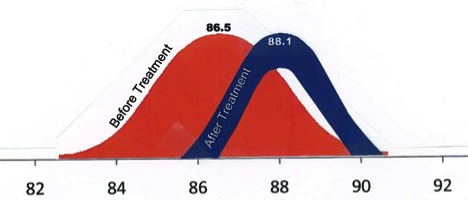
A great image to explain standard deviation
This data set comes from a high school student research project. He did a pretest data collection, treatment, and then a post test. Notice the pretest has a greater standard deviation than the postteest (spread) and that the posttest mean was greater than the pretest mean.
contributed by Frank LaBanca, EdD
Standard Deviation Formula
The formula for a sample standard deviation is:
