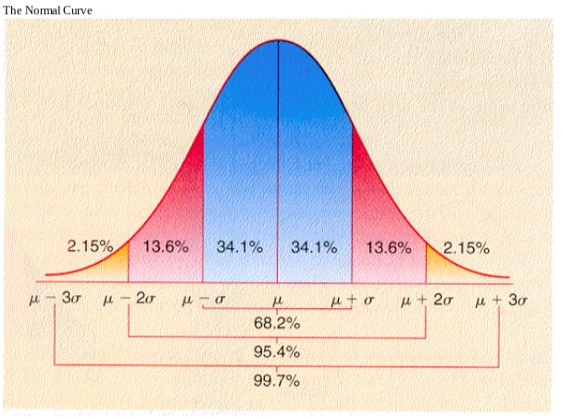
Identifying percentile ranks and scores based on standard deviation
To identify the values of data points at each standard deviation
1. Identify the mean and the standard deviation (ex: M=80; SD = 5) 2. Label the curve beginning with the mean at the 0 value. To identify the data value at each standard deviation (-3 to 3) multiple the label by the standard deviation, and then add that to the mean (ex: [(5 x -3) + 20 = 5] so 3 standard deviations below the mean would be 5
contributed by Ashley Brooksbank
To identify what the percentile rank exists at each standard deviation
1. Use the above process to label the mean and standard deviations on the normal curve 2. Add together the percentage of scores that exist to the left of that data point
contributed by Ashley Brooksbank
To identify the percentage scoring between x and y score
1. Use the above process to label the mean and standard deviations on the normal curve 2. Identify what standard deviation x score aligns with what standard deviation y score aligns with 3. Add together all percentage of scores that exist between the two data points
- This is only to be used if score x and y fall on a standard deviation**
contributed by Ashley Brooksbank
